Customer service has its own language. Here is how to translate the numbers into the business outcomes that actually matter.
Spend enough time in an e-commerce business, and you will hear two very different conversations.
In one meeting, the marketing and leadership teams are discussing customer acquisition cost (CAC), average order value (AOV), return on ad spend (ROAS), and customer lifetime value (LTV). In another meeting, the customer experience team discusses first response time (FRT), average handle time (AHT), customer satisfaction (CSAT), and first contact resolution (FCR).
Both groups are looking at dashboards. Both are trying to improve performance. And both are ultimately responsible for the same thing: the customer relationship. Yet the connection between these two sets of numbers is often surprisingly weak.
That is worth examining because customer service has evolved well beyond answering questions and processing returns. For a growing direct-to-consumer (DTC) business, the CX operation influences customer confidence, repeat purchasing, retention, and the economics of acquiring new customers.
Understanding the language of customer service is not about turning founders into support managers. It is about recognizing which operational metrics deserve a place in a larger business conversation.
Two dashboards, one customer
Consider a fairly ordinary e-commerce scenario.
A brand spends $40 acquiring a customer who makes a $100 purchase. The marketing dashboard records the acquisition, the conversion, and the revenue. So far, so good. A week later, the customer contacts support because the order arrived damaged. The CX dashboard now records a ticket, a response time, a resolution time, and perhaps a satisfaction score.
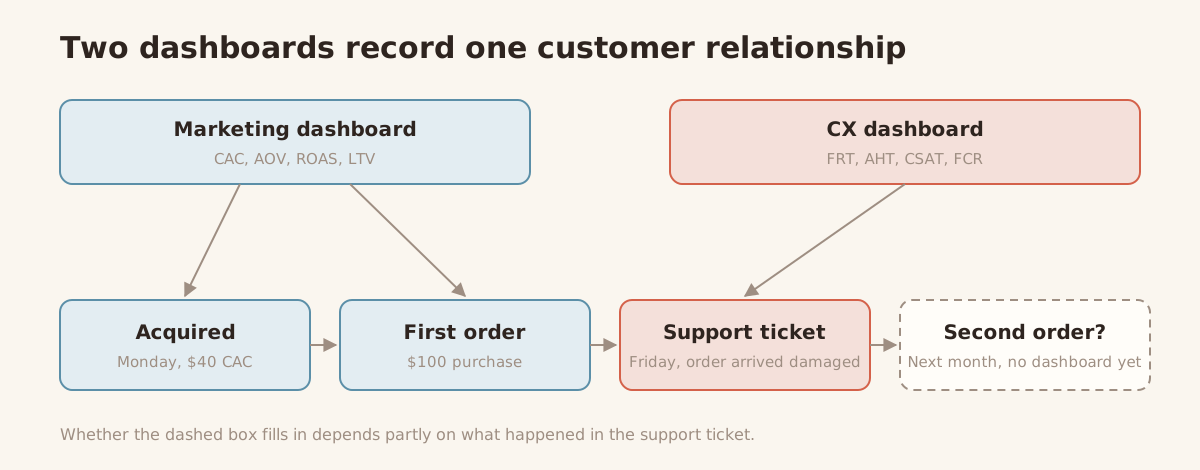
From an organizational perspective, these are two separate events. From the customer’s perspective, they are part of the same purchase. Whether that customer returns for a second or third order may depend partly on what happens during the support interaction.
That is where CX metrics and commercial metrics begin to overlap. And it is why decision-makers should understand what their customer service dashboards are actually telling them. We will come back to this customer at the end of the post.
Speed: FRT, AHT, and resolution time
Let us start with three measurements that often get grouped together, even though they describe different things.
First Response Time (FRT) measures how long a customer waits before receiving an initial response. A fast FRT can reassure customers that someone is paying attention, particularly when an order is late or a problem is time-sensitive.
But speed alone does not establish quality. An automated acknowledgment delivered in five seconds may improve a reported response-time metric, depending on how the platform measures it. That does not necessarily mean the customer received meaningful assistance.
Average Handle Time (AHT) measures the average amount of agent time spent handling an interaction, often including associated follow-up work.
It is an important productivity metric. Lower handling time can mean more capacity and lower operating costs. But reducing AHT is not automatically an improvement.
If an agent spends an additional three minutes understanding a customer’s problem and prevents another contact tomorrow, the longer interaction may be the more efficient outcome overall.
Resolution Time measures how long it takes to resolve an issue, although the exact definition varies between platforms.
This is often more useful than initial response speed because it gets closer to the customer’s actual concern: how long did the problem remain a problem?
For executives, these three metrics should be considered together. A fast response followed by a three-day resolution is not necessarily better than a slightly slower response that solves the issue immediately. The commercial question is whether the support operation is removing friction from the customer journey, not simply moving tickets through a queue.
Resolution: FCR, repeat contacts, and reopened tickets
First Contact Resolution (FCR) measures the proportion of customer issues resolved during the first interaction, without requiring additional contact.
In principle, a high FCR is excellent. Customers generally do not want to explain the same problem three times, and businesses do not want to pay to handle the same issue repeatedly. As a rough rule of thumb, well-run ecommerce support teams tend to land somewhere in the 70 to 80 percent range, but the definition matters more than the number.
Some platforms measure FCR by whether a ticket was closed after one exchange. Others use repeat-contact windows or customer confirmation. A closed ticket and a solved problem are not necessarily the same thing. That is why Repeat Contact Rate and Reopen Rate deserve attention.
Repeat contact measures how frequently customers return with the same or related issue. Reopen rate tracks tickets that return to an active state after being marked resolved.
These are useful checks against overly optimistic resolution reporting.
Imagine a support team that closes tickets quickly but regularly receives follow-up messages from customers who still need help. The dashboard might show excellent productivity. The customers might tell a very different story.
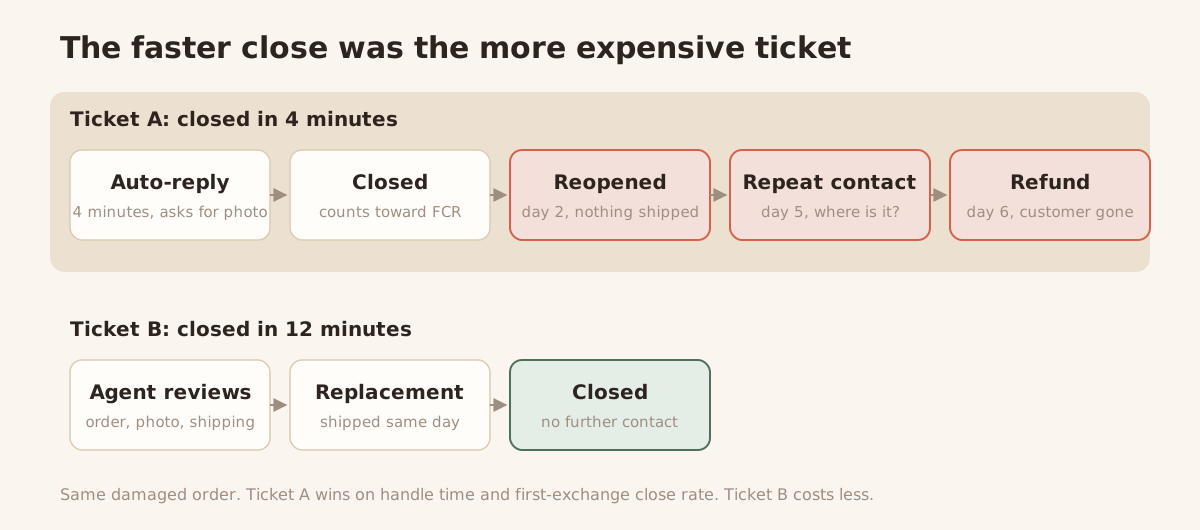
For DTC operators, repeated contacts also create costs that extend beyond support payroll. They consume customer time, increase frustration, and may contribute to cancellations, refunds, or negative reviews.
The objective should be durable resolution, not simply rapid closure.
Experience: CSAT, CES, and QA
Customer satisfaction is one of the most recognizable support metrics, but it is also one of the easiest to oversimplify.
Customer Satisfaction Score (CSAT) typically asks customers how satisfied they were with an interaction, often using a numerical scale or a positive/negative rating.
It provides useful feedback, especially when tracked consistently. Most ecommerce teams treat anything above roughly 80 percent positive as healthy, though the response rate matters as much as the score. CSAT is usually based on customers who choose to respond. That creates potential response bias, and a good score does not guarantee that customers will purchase again.
Customer Effort Score (CES) approaches the experience differently.
Rather than asking whether someone was satisfied, it asks how easy or difficult it was to accomplish what they needed. This matters because customers may appreciate a friendly support agent while still finding the overall process exhausting. A customer who has to repeat their order number, explain the same issue to three people, and wait for multiple approvals may eventually receive a satisfactory outcome.
But the effort required to get there is part of the experience.
Then there is Quality Assurance (QA).
QA evaluates the actual work being performed, including accuracy, policy compliance, tone, completeness, and how appropriately an agent handled the situation.
Unlike CSAT, which captures a customer’s reported experience, QA can identify problems that customers may not recognize immediately. An incorrect refund explanation might receive a positive satisfaction rating because the agent was friendly. A good QA process can still catch the mistake.
For leadership, these measures provide different perspectives. CSAT asks how the interaction felt. CES asks how difficult it was. QA asks whether the work was done properly.
You need all three perspectives to understand service quality.
Efficiency: deflection rate and cost per resolution
Here is where customer service metrics become particularly interesting from a financial perspective.
Deflection Rate generally measures the proportion of support demand handled without human agent involvement, although platforms define and calculate it differently.
Knowledge bases, self-service tools, chatbots, and autonomous AI systems can all contribute to deflection. And there is nothing inherently wrong with that.
If a customer needs a tracking number, providing it instantly through self-service is usually better than making them wait for an agent. The trouble begins when maximizing deflection becomes the objective rather than improving the customer experience.
We have written about this before because it is an important distinction, and it matters more now than it did a year ago. Most ecommerce leaders are being pitched fully autonomous support agents on a weekly basis, usually with a headline deflection number attached. A 70 percent deflection rate sounds like a 70 percent cost reduction. It is not, unless those 70 percent of conversations were actually resolved.
The metrics that expose the difference are the ones from the previous section. If an AI agent closes a ticket and the customer writes back two days later, that shows up in repeat contact rate and reopen rate, not in deflection. Any automation vendor who reports deflection without those two numbers beside it is reporting half the story.
A customer who asks where an order is may need a tracking link. A customer who asks where an order is after three failed deliveries may need a person capable of exercising judgment. Both inquiries might initially look identical to an automated system. Their commercial significance may be very different.
Cost per Resolution is another important efficiency measure. It attempts to quantify what the business spends to resolve customer issues.
The distinction between cost per ticket and cost per genuinely resolved issue matters. A cheap interaction that leads to two more contacts, a refund, and a lost customer may not be particularly cheap after all.
Executives should evaluate automation and support costs alongside resolution quality, repeat contacts, and customer outcomes. Efficiency is important. But efficiency without context can become expensive.
Demand: ticket volume, contact rate, and escalation rate
Not every CX metric measures the performance of the support team. Some reveal problems elsewhere in the business.
Ticket Volume measures the number of support conversations or tickets received over a period. On its own, volume tells you very little. A growing business should generally expect more customer interactions as order volume increases.
That is why Contact Rate can be more informative. It measures support demand relative to an underlying activity, such as orders or customers. For example, if a store receives 200 support inquiries from 2,000 orders, that is 100 inquiries per 1,000 orders, assuming the business defines and counts inquiries consistently.
Benchmarks vary a lot by category. Apparel and anything with sizing runs higher than consumables, and subscriptions run higher than one-off purchases. Most DTC brands land somewhere between 50 and 150 inquiries per 1,000 orders. The number matters less than the direction.
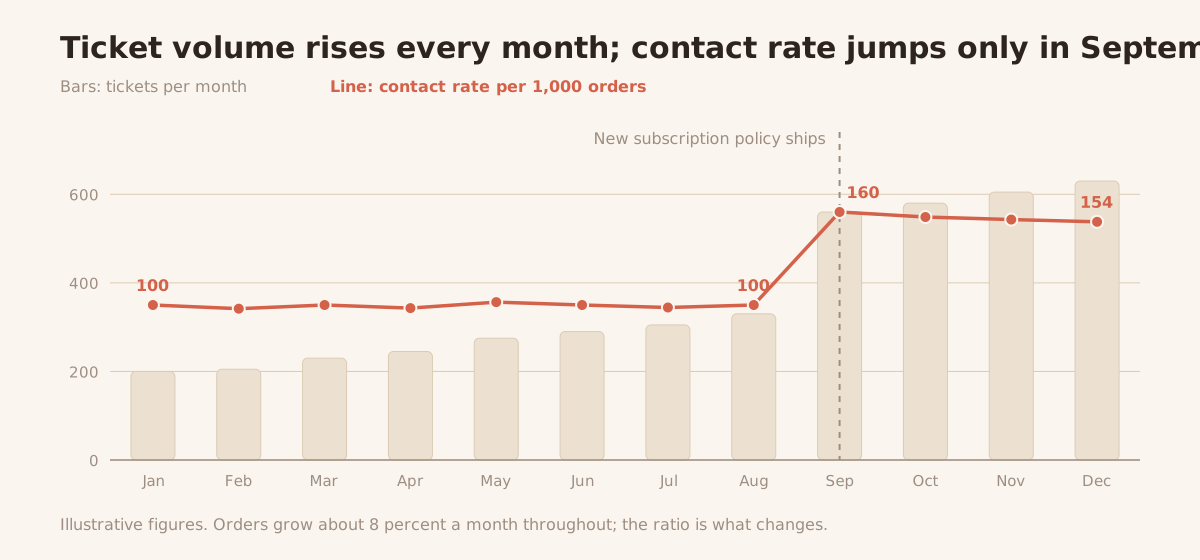
In the chart above, ticket volume climbs every month, which looks like growth. Contact rate is flat until September, when it jumps. That jump is the signal. Ticket volume alone would have hidden it.
If that ratio rises sharply, something may have changed. Perhaps shipping times have deteriorated. Maybe a product description is confusing. Perhaps a new subscription policy is generating questions. Support demand can become an early warning system for operational problems.
Escalation Rate measures the proportion of interactions requiring additional authority, expertise, or intervention. A rising escalation rate might indicate that frontline agents need better tools, clearer policies, or more decision-making authority. It might also signal that the underlying issues are becoming more complex.
The important point is that customer service data can tell executives something about fulfillment, merchandising, product quality, and business operations. The support team is often the first department to hear that something is not working.
Where CX meets the DTC dashboard
Now we can connect the two sides. DTC executives are already familiar with the commercial vocabulary.
- CAC measures the cost of acquiring a customer.
- AOV measures average revenue per order.
- ROAS compares advertising-attributed revenue with advertising spend.
- LTV estimates the value generated by a customer over their relationship with the business. Whether that value is expressed as revenue or contribution profit depends on the model.
- Churn measures customers or subscribers lost over a period, while repeat purchase rate measures how frequently customers return to buy again.
These are not interchangeable measures, and customer service does not control all of them. But CX can influence several of the underlying behaviors. A better product recommendation during support may increase purchase confidence. A well-handled complaint may preserve a subscription. A faster, more accurate resolution may prevent a refund or chargeback. A recurring shipping complaint may reveal a fulfillment problem that, once corrected, improves retention across the customer base.
Let us go back to the customer from the opening. $40 to acquire, $100 first order, damaged on arrival.
In one version, the ticket gets an automated reply in four minutes, a replacement is approved two days later after a photo request, the customer writes back to ask where it is, and the ticket is reopened once before it ships. The customer never orders again. The marketing dashboard shows a 2.5x return on that $40. The real return, after the replacement and the second shipment, is closer to break-even.
In the other version, an agent sees the order, the damage photo, and the shipping history in one view, apologizes, and ships a replacement the same day. One contact, closed. The customer orders twice more over the next six months. Same $40, same first order, roughly $300 in revenue instead of $100.
None of that proves the support interaction caused the second and third orders. The point is that the two versions look identical on the marketing dashboard and completely different on the CX dashboard, and only one of them is the business you want.
None of those relationships should be assumed from a single dashboard. They should be investigated. And that is the opportunity for leadership.
Instead of asking only whether support costs are declining, ask whether customers who receive support continue purchasing. Instead of celebrating a high deflection rate in isolation, examine repeat contacts and satisfaction. Instead of evaluating agents solely on handling time, look at whether their resolutions hold up and whether important customer relationships are being protected.
The goal is not to turn every CX interaction into a sales opportunity. It is to recognize that customer service is already part of the commercial operation.
A practical executive scorecard
If I were reviewing a growing ecommerce business, I would not want a report containing fifty disconnected support metrics. I would want a small set of measures that connect operational performance with customer outcomes.
| Question for leadership | CX measures to examine | Business outcome to investigate |
|---|---|---|
| Are customers getting help quickly? | FRT, resolution time | Purchase friction, complaints |
| Are problems actually being solved? | FCR, repeat contact, reopen rate | Retention, refunds, repeat purchasing |
| Is the experience improving? | CSAT, CES, QA | Customer confidence, loyalty |
| Are we automating appropriately? | Deflection, cost per resolution, escalation | Support economics, customer outcomes |
| What is creating support demand? | Contact rate, ticket topics, volume | Product, fulfillment, and operational performance |
This is not a claim that changing one CX metric automatically changes LTV. It is a framework for asking better questions.
Ideally, teams would also connect support records with customer and order data, allowing leadership to examine retention and purchasing behavior after different kinds of service interactions.
That analysis requires care. Customers who contact support are, by definition, customers who had a problem, so they will usually retain worse than customers who never needed to get in touch. Comparing the two groups tells you that problems are bad for retention, which you already knew. The useful comparison is inside the supported group: customers whose issue was resolved in one contact against customers whose ticket was reopened, or customers who rated the interaction well against those who rated it poorly. Differences there still do not prove causation, but they point at the part of the operation you can actually change.
Even with those limitations, the information can reveal patterns worth understanding.
What to do on Monday
Pick one row of the scorecard. For most brands, the second row is the right place to start.
- Pull every ticket from the last 90 days and tag whether it was resolved in one contact, reopened, or followed by a repeat contact.
- Match those tickets to customers and check whether each customer placed another order in the 90 days after the ticket.
- Compare the repeat purchase rate across the three groups.
That is it. One afternoon, one spreadsheet. If the gap between “resolved once” and “reopened” is large, you have a number to put in front of whoever is pushing for faster closes, and you know which row of the scorecard deserves the next month of attention. If the gap is small, you have learned that resolution quality is not your constraint right now, which is also worth knowing.
The only prerequisite is that your support records and your order records can be joined. If they cannot, that is the first thing to fix.
Better tools make the connection possible
A few weeks ago, we discussed why growing ecommerce teams eventually need a unified inbox. Assignments, conversation history, customer context, and clear ticket ownership are fundamental to running an organized support operation. But there is a larger opportunity in bringing those pieces together. A good CX system should help teams understand not just how many tickets they are processing, but what is happening inside those customer relationships.
At HumanTouch, we are building around that philosophy.
Our Shopify-native helpdesk connects conversations with customer and order context, which is what makes the Monday exercise above a query rather than a project. Hewie, the AI assistant built into the helpdesk, helps support professionals retrieve information and prepare responses, while verified humans remain responsible for what reaches customers.
The objective is not simply to move more tickets through the system. It is to give capable people better information, better tools, and more time for the interactions where their judgment matters. And for business leaders, that creates a foundation for understanding CX as part of the broader customer journey.
The language of customer service is the language of business
There is a reason customer experience teams have developed their own vocabulary. They manage a complex operation with competing demands: speed, quality, efficiency, accuracy, cost, and customer expectations. Those measurements are useful.
But they become considerably more valuable when leadership understands what they mean beyond the support dashboard. A founder does not need to obsess over every acronym. A CEO does not need to personally manage first response time. And a growth executive does not need to become a support supervisor. What they do need is a shared understanding of how customer experience contributes to the economics of the business.
Because the customer who appears in your CAC report on Monday may be the same customer who appears in your support queue on Friday. And whether they appear in your repeat purchase report next month may depend, at least in part, on what happened in between. Two dashboards. One customer relationship.
It is probably time we started reading them together.